How trial and appellate courts should review challenges to outsize noneconomic damages awards has been the talk of the Texas bar.
While the Texas Supreme Court’s 2023 opinion in Gregory v. Chohan did not finally resolve this issue, the Court indicated its openness to verdict comparisons as a means to ascertain whether “a given amount of noneconomic damages is reasonable and just compensation rationally grounded in the evidence.”
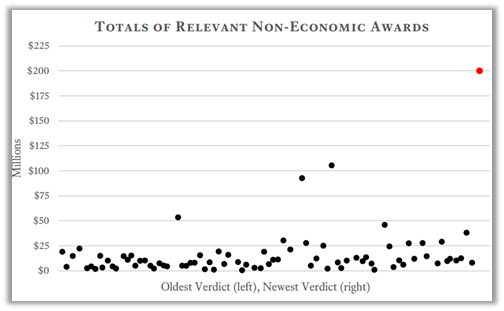
So, when the facts permit, defense counsel should consider using visuals such as scattergrams, like the ones depicted below, to show that a verdict — or an award for a particular damages element — lies so far outside the norm for the type of injury sustained by the plaintiff as to be grossly excessive.
We used scattergrams in our new trial motion in Cecilia Cruz et al. v. Allied Aviation Fueling Company of Houston, Inc. and Reginald Willis, which we believe had a compelling effect. In that vehicular/pedestrian accident case, the trial court reduced the initial $352.7 million judgment on the verdict (90% of which was noneconomic damages) by $117.5 million via remittitur, resulting in a $235.3 million amended judgment — about a one-third reduction. Then, after we filed our opening brief on appeal — again relying on scattergrams — we were able to settle the case for an amount far less than the amended judgment.
What exactly is a scattergram, you ask? It is a visual way to depict data — in our case, a verdict or particular damages award — in a manner that shows how one data point relates to the other data points. We started by preparing a chart of all the verdicts we could find between 2000 and the 2021 judgment (whether appealed or not) that involved catastrophic, nonlethal injuries and for which the verdict information was available and verifiable. Our finalized data set by the time of appellate briefing comprised 79 verdicts. For each comparator case, the chart provided a description of the case, the injuries and the relevant damages. Drawing from this data, we were able to build scattergrams that visually depicted what an extreme outlier the jury’s verdict was.
The scattergrams showed how each element of the amended judgment stacked up against awards for that element in the dataset. For example:


And adding the relevant elements together, we were able to show how the overall noneconomic damages award related to verdicts in comparable cases:

After we compiled personal-injury verdicts for the Cruz case, the Haynes and Boone appellate team compiled a set of wrongful-death verdicts for use in another appeal. Using this information, our appellate team can create scattergrams to graphically depict how any pending personal-injury or wrongful-death award compares to other verdicts.
Visuals like these provide a court guidance as to a possible range of reasonableness for a particular damages award and help identify clear outliers that fall outside this zone of reasonableness. They allow the judge to see how and where a verdict “fits” in the broader landscape of Texas awards, in contrast to a typical “comparable case” approach that focuses on just a handful of cases with analogous facts.
We have written previously about the power that visuals have to enhance written advocacy. Like photographs, maps, timelines, graphs and flowcharts, scattergrams can convey data in a more powerful and memorable way than simply explaining the data in writing. There is simply no better way to help courts contextualize the size of verdicts to determine whether a particular noneconomic damages award “shocks the conscience” or falls so outside the zone of reasonableness as to require remittitur or a new trial.
In sum, the case comparisons depicted in scattergrams offer a useful proxy for evaluating excessiveness. The comparison methodology also helps identify true outlier verdicts and ensures that similarly situated plaintiffs receive comparable awards, bolstering the equality, predictability and overall fairness of the Texas legal system.
